Data Visualization

One of the most exciting parts of the data analysis process

It’s art and science!

Obtain a competitive advantage for your business through automated reports

Data Visualization

One of the most exciting parts of the data analysis process

It’s art and science!

Obtain a competitive advantage for your business through automated reports

Data Visualization

Data Visualization is all about telling data stories through visualization. You have the power to tell compelling stories that could change opinions. It can also be the difference between total confusion or the real understanding of a problem.

Creating data visualizations is a complex task, so we want to help you achieve meaningful, compelling, and easy-to-understand visualizations that are highly relevant to your decision-making process, with the ability to turn complex information into meaningful insights.

One of the reasons why data visualization is so effective is because people’s eyes are drawn to colours, shapes, and patterns, making these images perfect for telling a story that transcends numbers.

 This can change the perspective and allow you to understand the data in a new and different way.

We deliver what you need
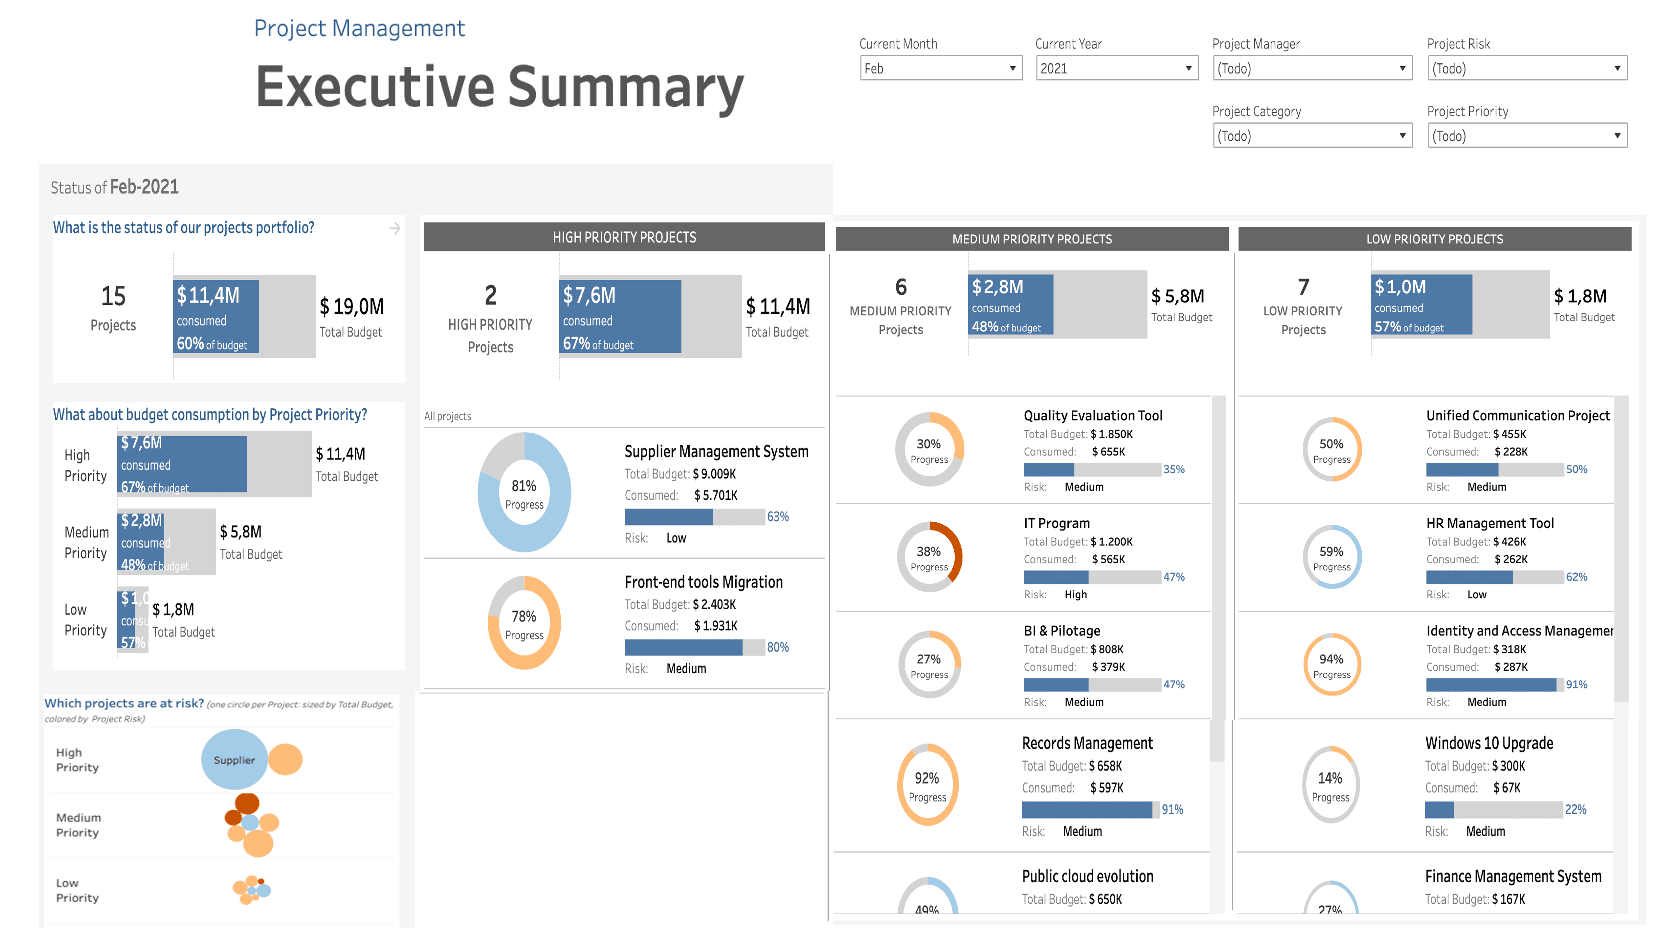
Automated reports

We design and create automated reports, turning data into knowledge.

The real power lies in data visualization and the new way of doing business leads us to use data to tell stories, using charts and visualizations, using analytics tools and techniques to make better decisions based on facts and data.

We include key elements to make visualizations powerful and meaningful: the information or data analyzed, the story or concept that adds meaning to the data and makes it interesting, the purpose that makes our data useful, and visual representations to create beauty and structure.

Save time and money with automated reports

Automated reports Telecommunications Sector - Mobile

With these reports, it is possible to analyze the behavior of the traffic in the different nodes or radio-bases of the operator’s network, by days, weeks, and months, which allows taking actions to ensure the quality of the service.

Automated reports Telecommunications Sector - Mobile

With these reports you can analyze the number of calls made by the network, typical conversation and call establishment times, how many calls have been dropped and how many have been made in the different radio bases.

Automated reports Contact Center Sector

With these reports you can analyze the total incoming calls, total abandoned calls, average waiting time until answering, average call time, % resolution in first contact, customer satisfaction.

Automated reports Contact Center Sector

With these reports, it is possible to analyze how many calls are received daily on average, by hour of the day, throughout the month and by type of requirement, comparisons by months and years to assess growth and root cause resolution, times and days with peaks of calls.

Automated reports Website

With these reports, you can analyze how many customers are visiting the website, geographically where the customers are located and what time of day they are visiting the site, the conversion rate, orders and revenue, the trend over time, which channels they are more successful.

Automated reports Commercial Process

With these reports, key business questions can be answered, such as what are the sales results and profitability, how the customer base has been segmented, it is also possible to see the ability to attract new customers, and which lines of business generate the most sales.

Automated reports Commercial Process

With these reports you can analyze the customer life cycle, have a prediction of sales value according to customer behavior, and measure the abandonment rate to take proactive actions.

Automated reports Marketing Process

With these reports it is possible to analyze the income trend at a general level and by business line, the total income by business line, and the income Pareto.

Automated reports Commercial Process

With these reports you can analyze the behavior of the different products, their evolution over time at the level of sales and income, the behavior of prices, income, margins, and profitability.

Automated reports Project management

With these reports you can respond to the status of all projects, what budget has been consumed, evaluated by priority of the projects, which projects are at risk, and the detail of the projects by priority.

Automated reports Project management

With these reports, it is possible to analyze in detail what is the progress of the entire project portfolio, what has been its evolution at the level of compliance with times, and budget, and how the level of risk of each project has behaved.

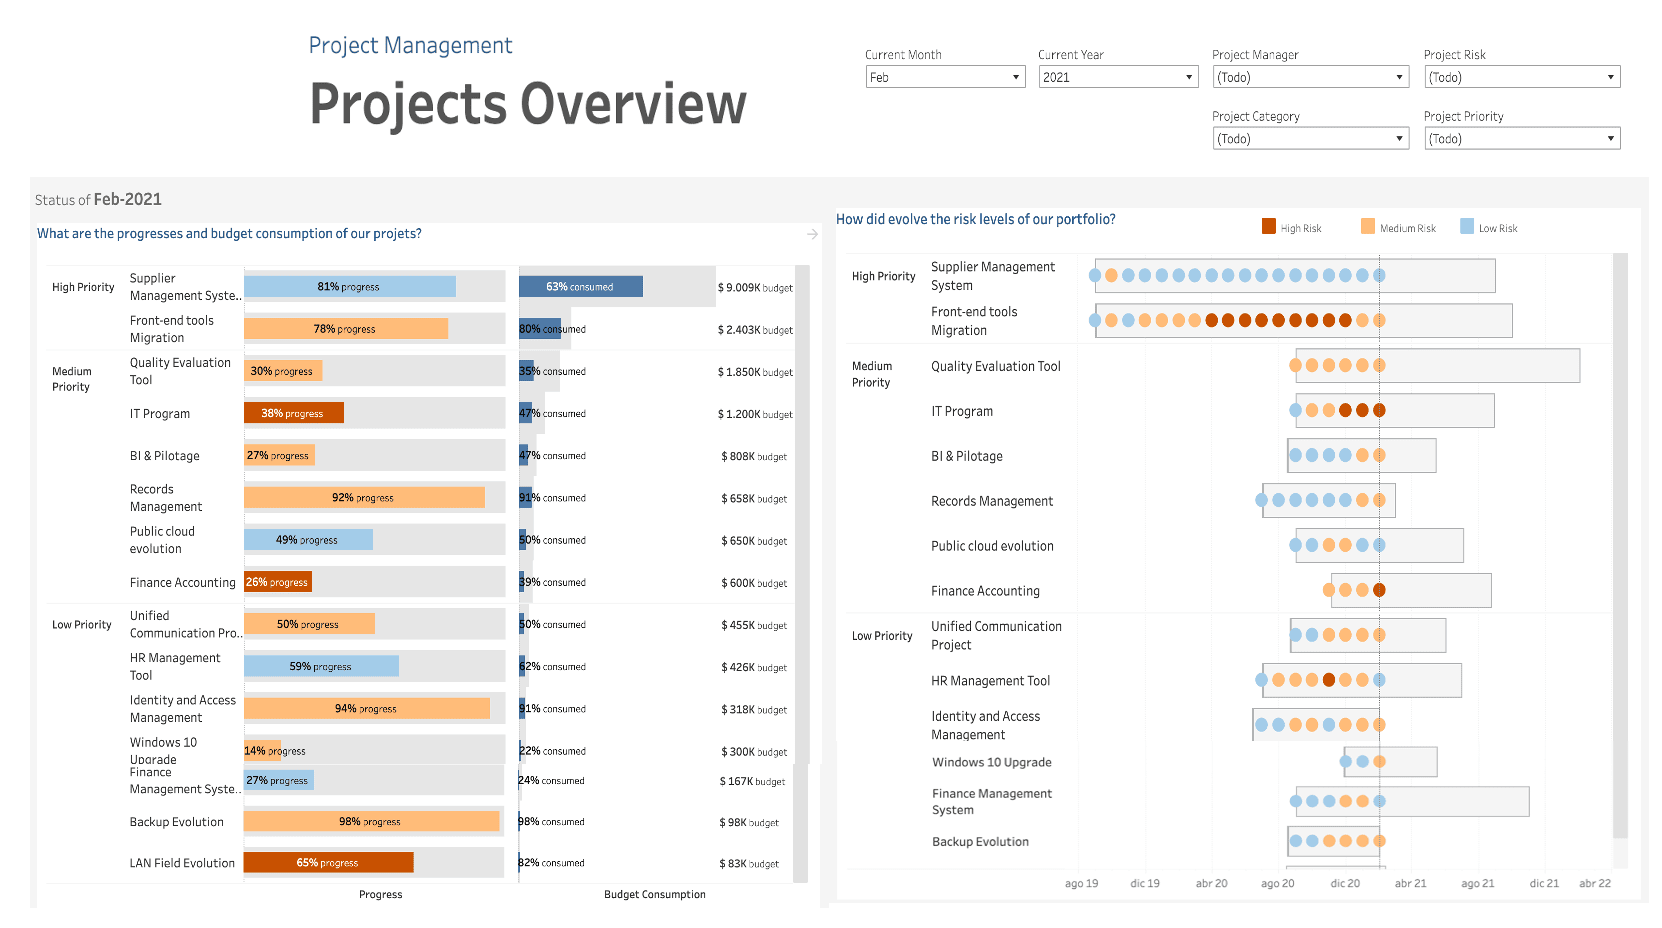
Managerial and operational reports

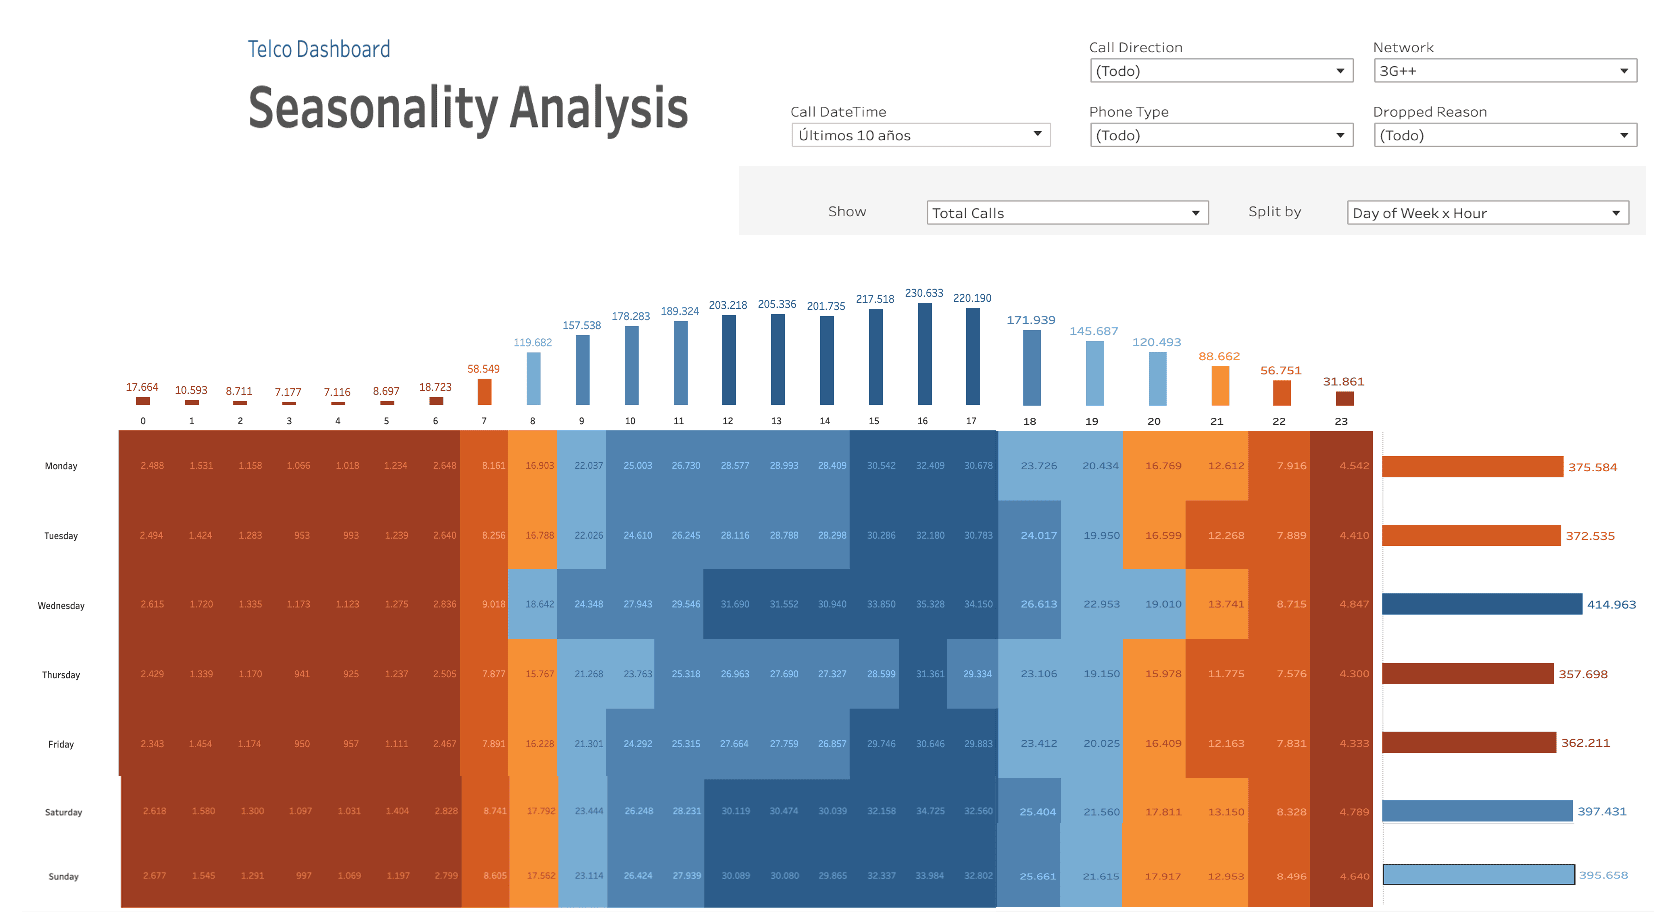
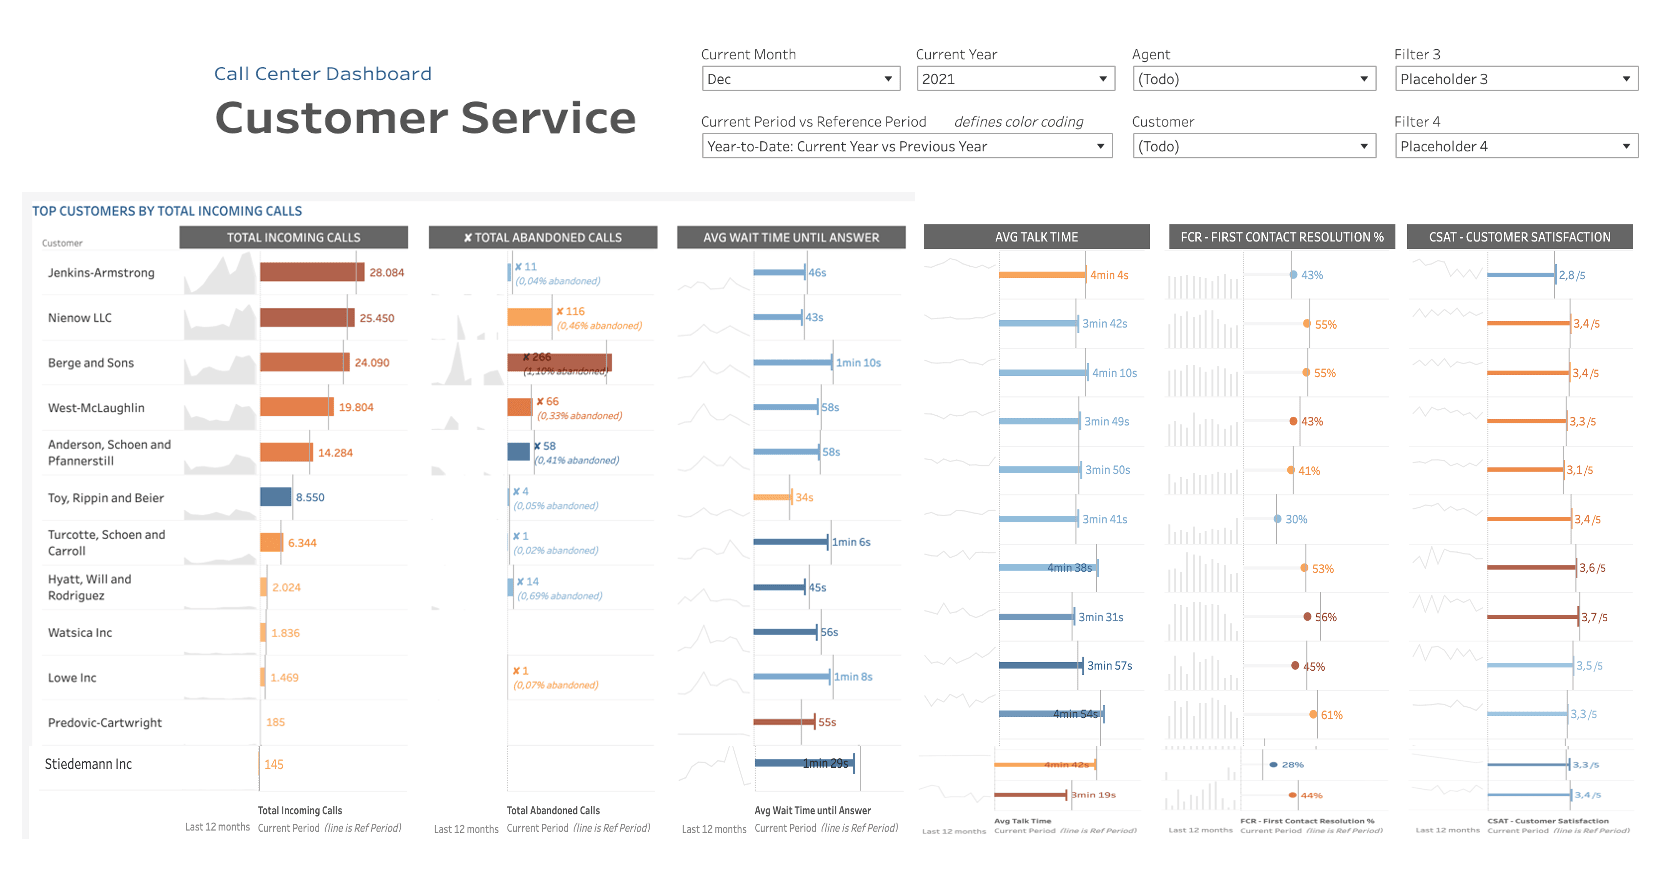
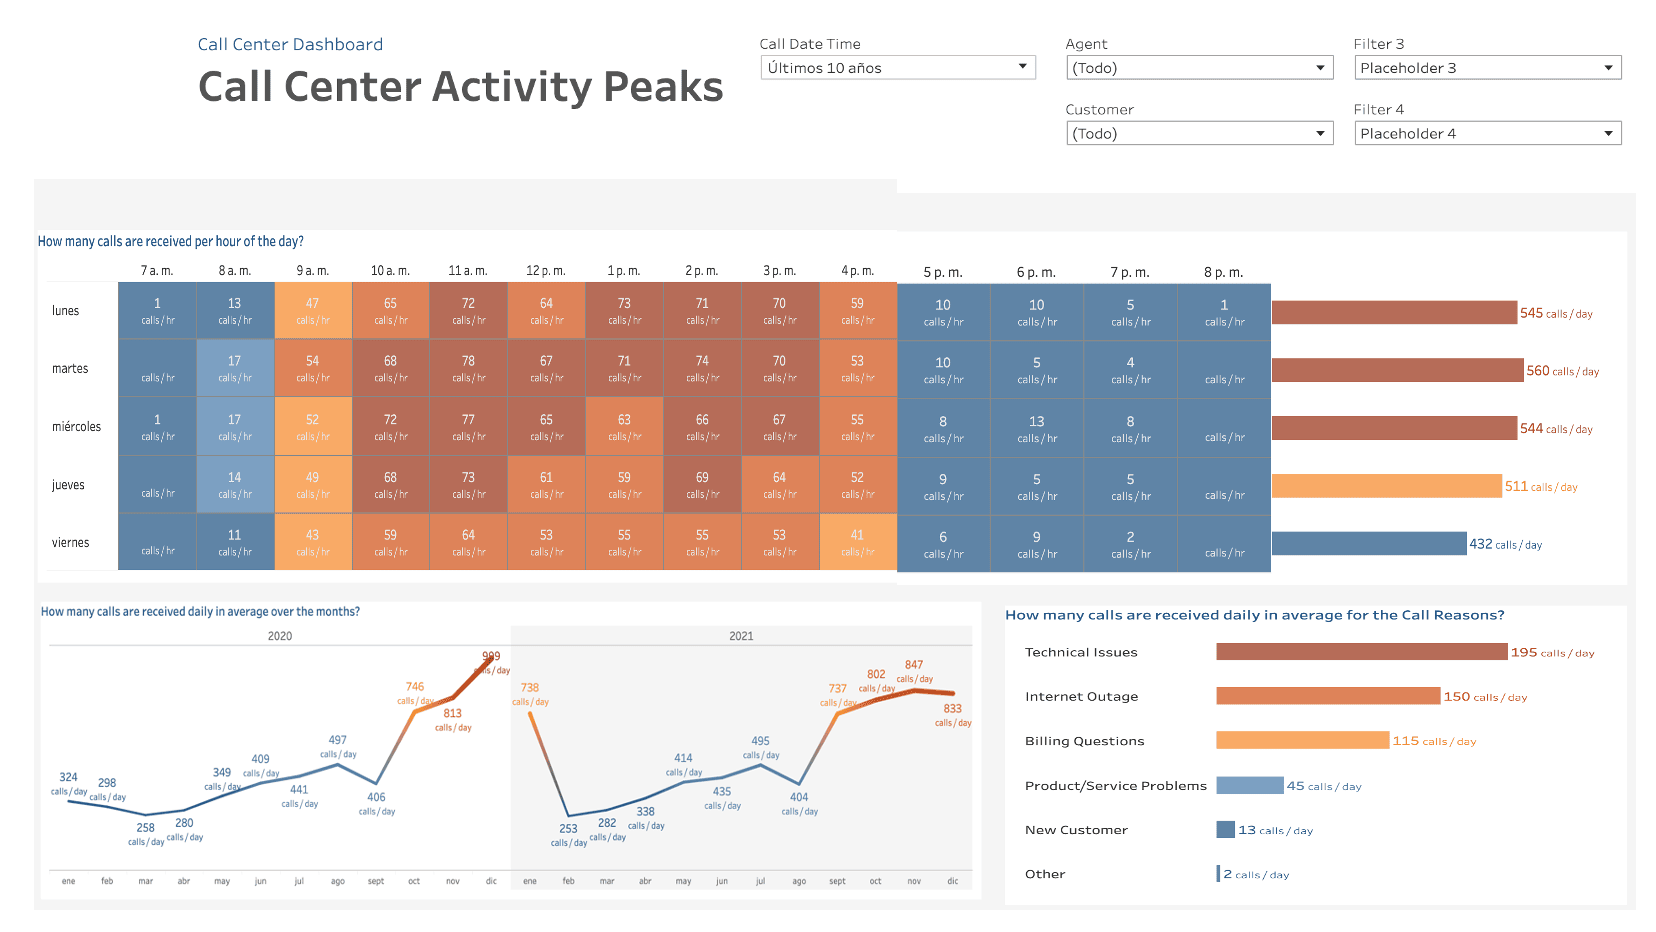
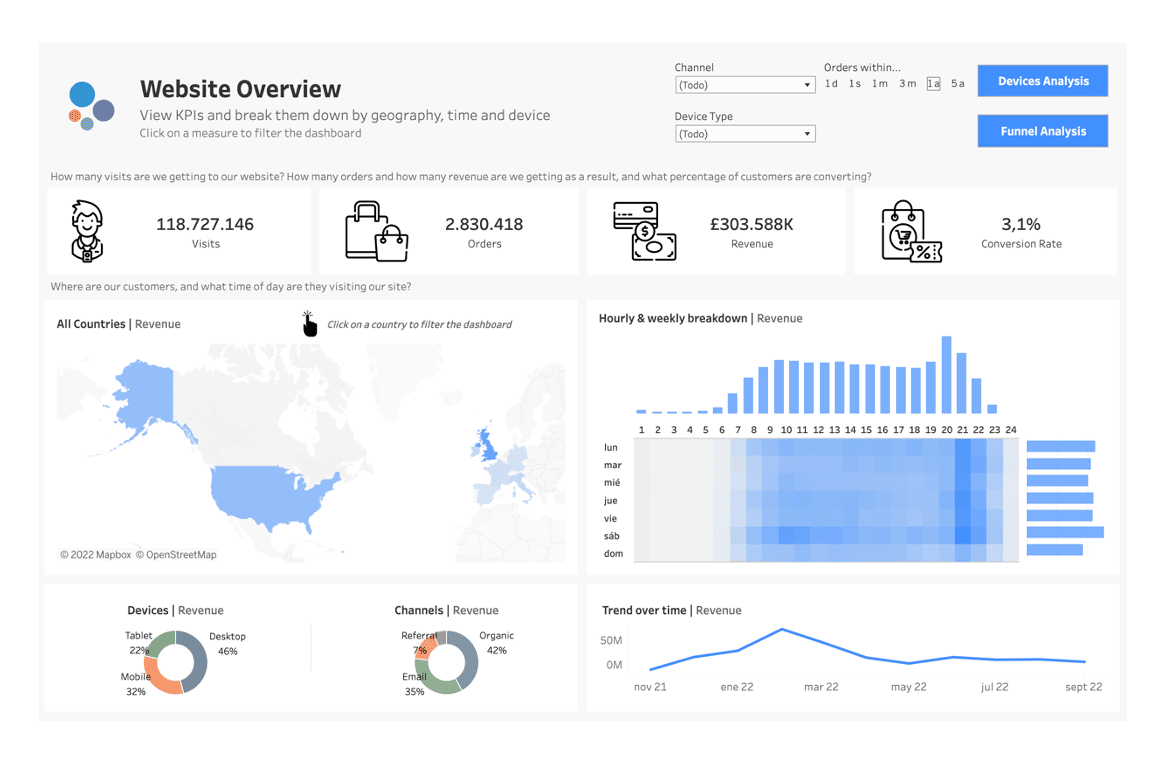
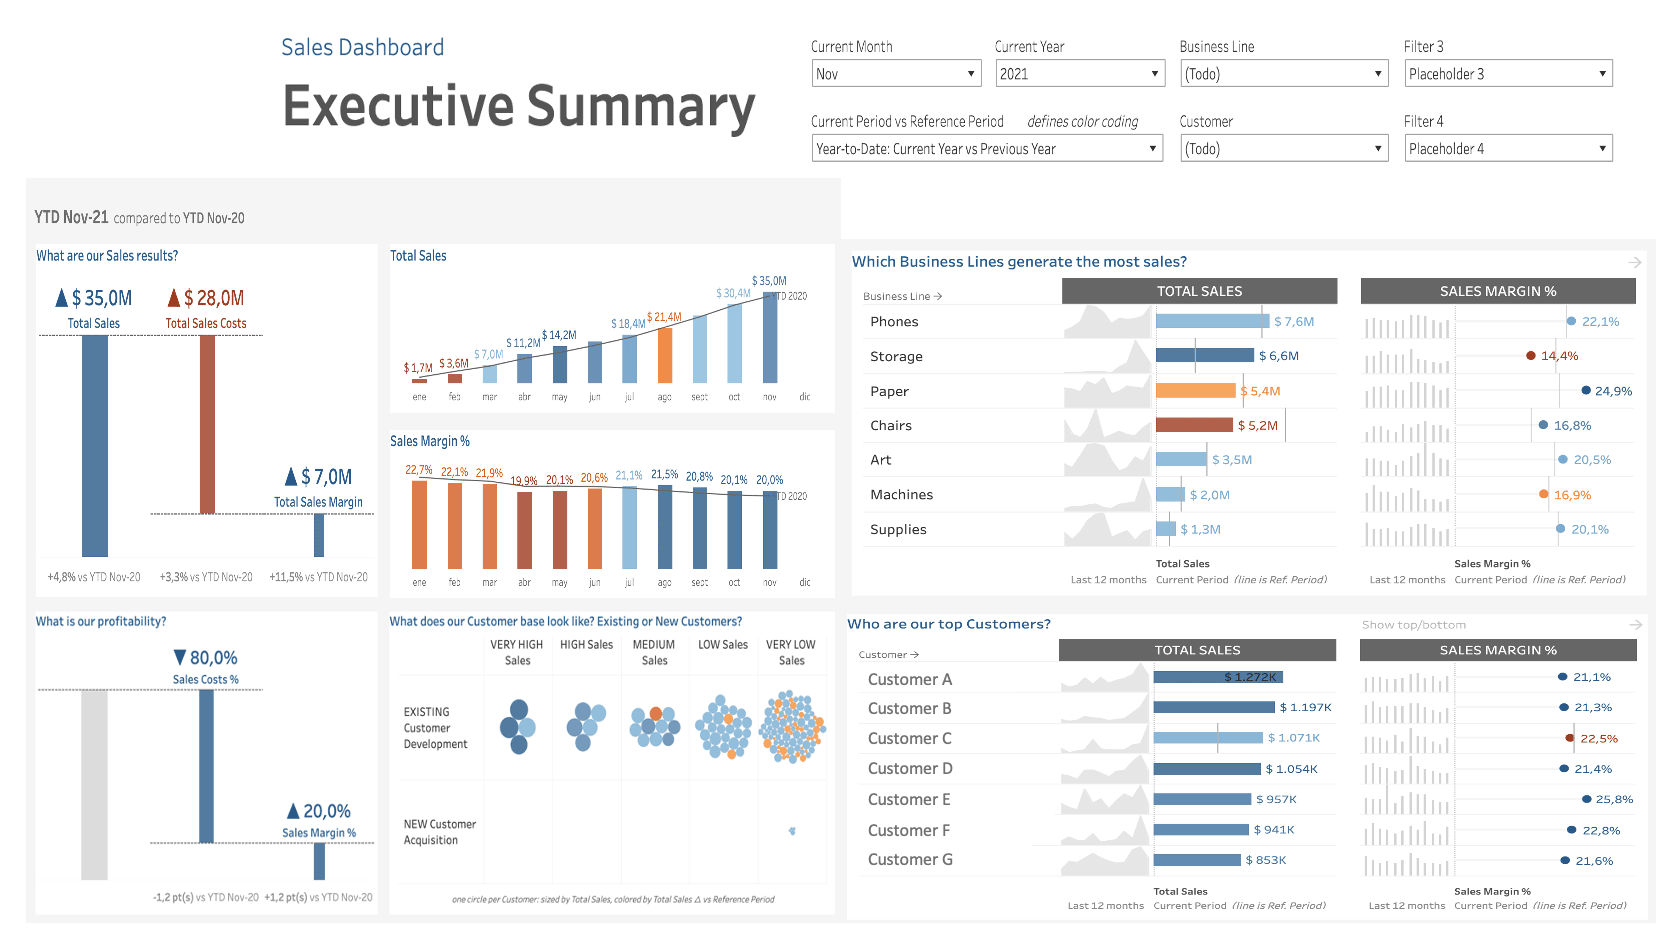
We design and create automated reports for each key area of the business. This will allow you to always see trends and patterns, it is possible to track changes over different time periods or visualizations of the behavior of KPIs and key metrics.

It is possible to see the information associated with the behavior of the business separated in different management and operational reports according to each need.

These reports can be generated with stored or real-time information that add value to business decisions and strategy, and that generate a competitive advantage.

You don’t need a BI department! We create it, maintain it, and update it.

Solution Benefits:

Develop and maintain a scalable, governed, and self-sufficient data environment within an ever-changing data landscape.

Build governance and trust in the data used to make decisions across the organization.

Increase discoverability so users can quickly and confidently find the right data for their analyses.

Effectively manage data at scale with repeatable processes to keep data and metadata updated.

You can access all your reports in a single place, at anytime

You can also view them from your laptop, tablet or mobile

We have a solution for each industry and each need

Start your journey here

Our team will be happy to advise you, with no obligation. Let’s discuss your project and find the perfect solution for your needs!

E-mail: info@binalytics.ai


© 2022 | Binalytics SAS Company | All Rights Reserved

Let’s talk
1
How can we help you?
Hi, we are here to help you.
Would you like to know more about Data visualization - Cloud and data analytics | Binalytics?