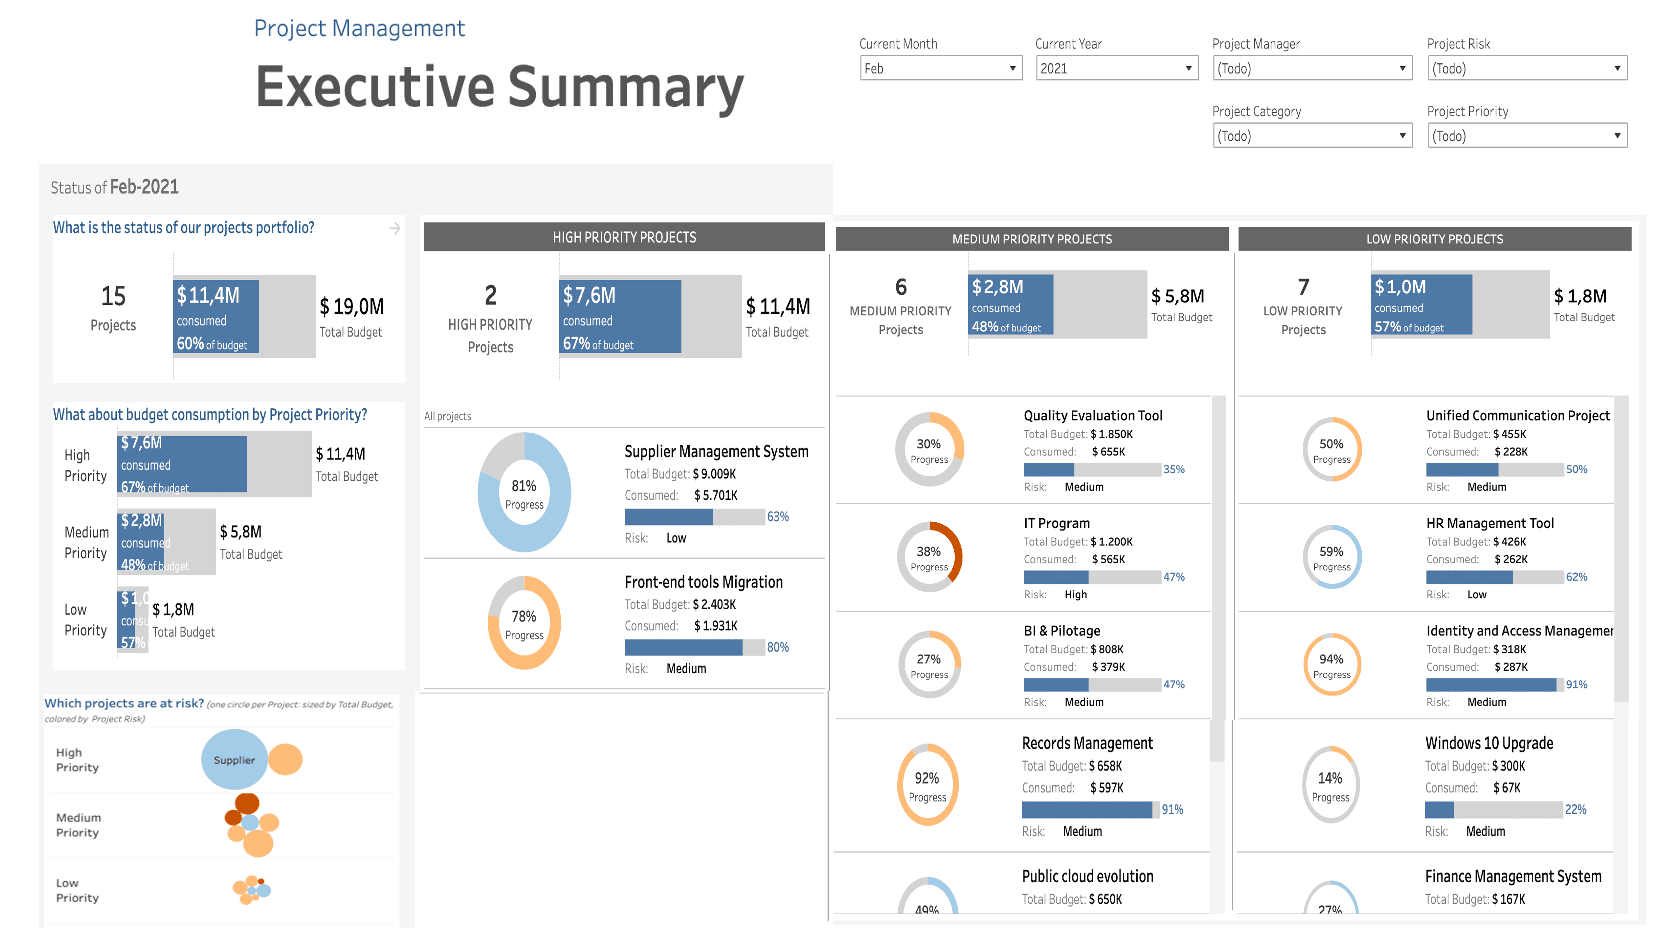
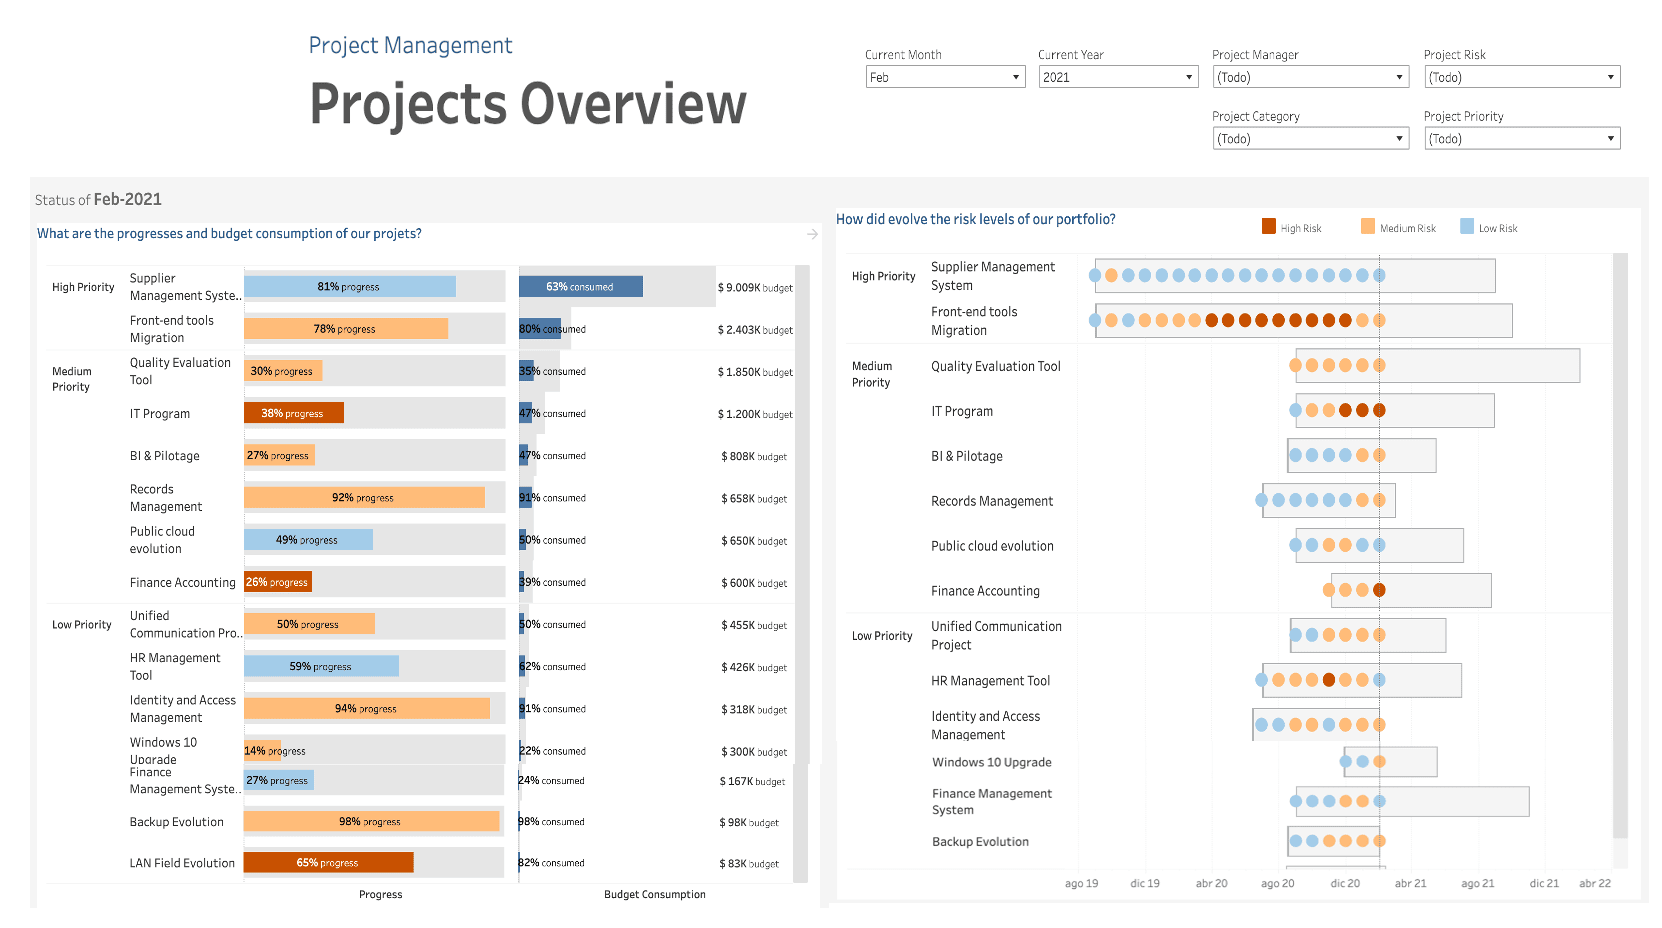
Data Visualization
Data Visualization is all about telling data stories through visualization. You have the power to tell compelling stories that could change opinions. It can also be the difference between total confusion or the real understanding of a problem.
Creating data visualizations is a complex task, so we want to help you achieve meaningful, compelling, and easy-to-understand visualizations that are highly relevant to your decision-making process, with the ability to turn complex information into meaningful insights.
One of the reasons why data visualization is so effective is because people’s eyes are drawn to colours, shapes, and patterns, making these images perfect for telling a story that transcends numbers.
This can change the perspective and allow you to understand the data in a new and different way.
We deliver what you need
Automated reports
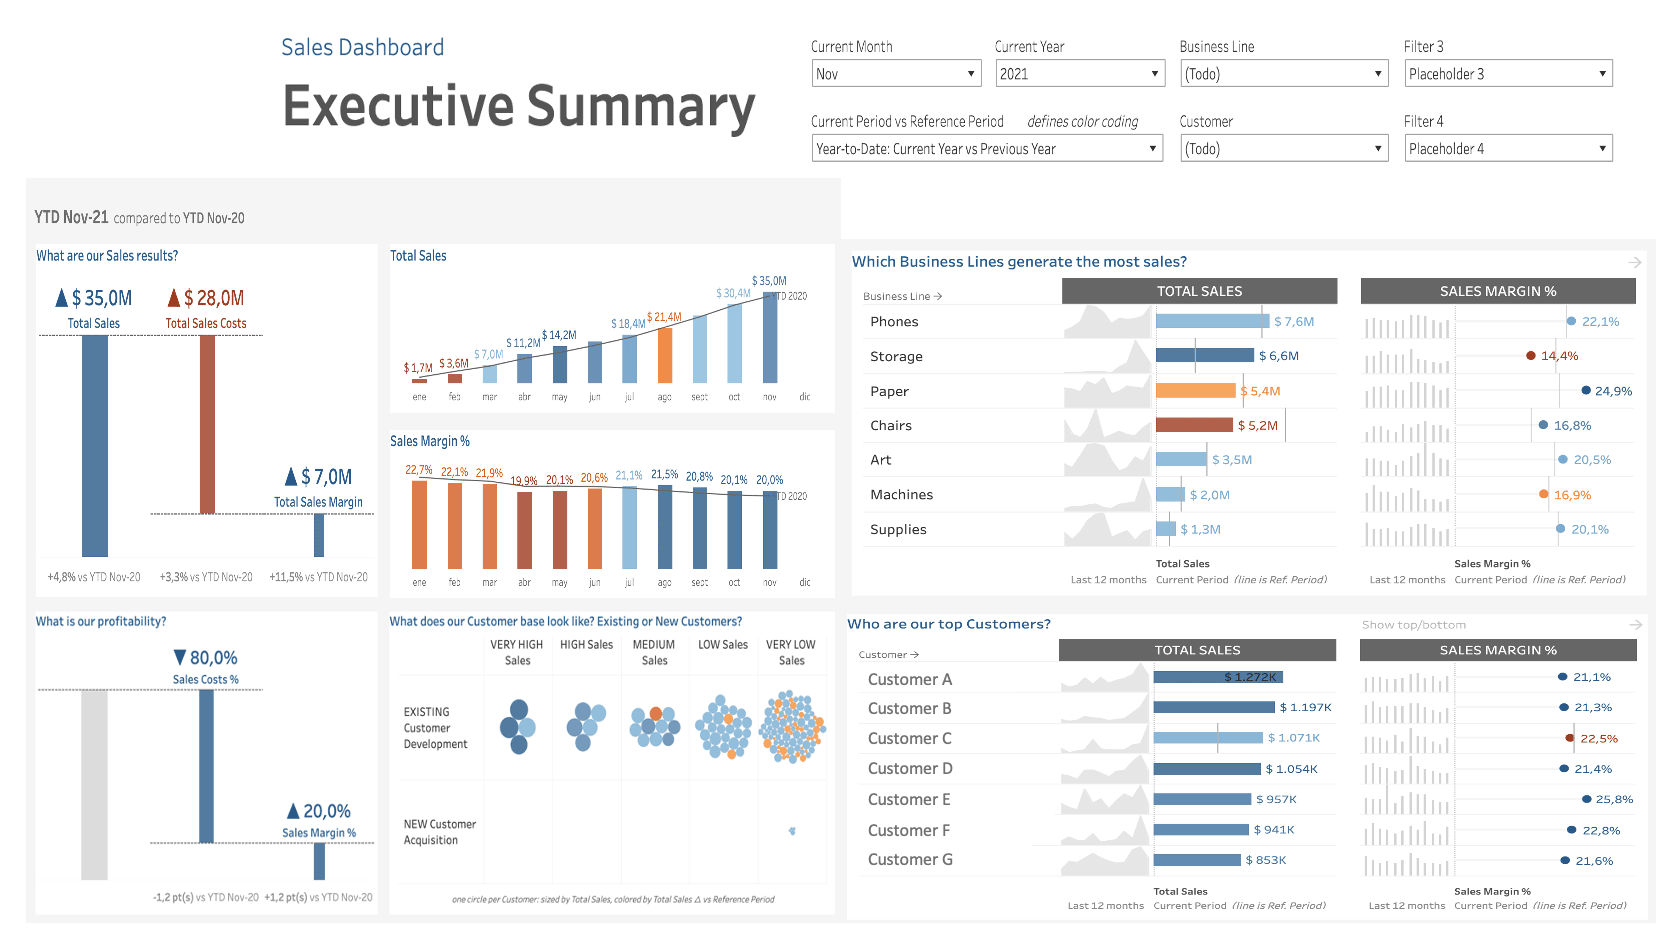
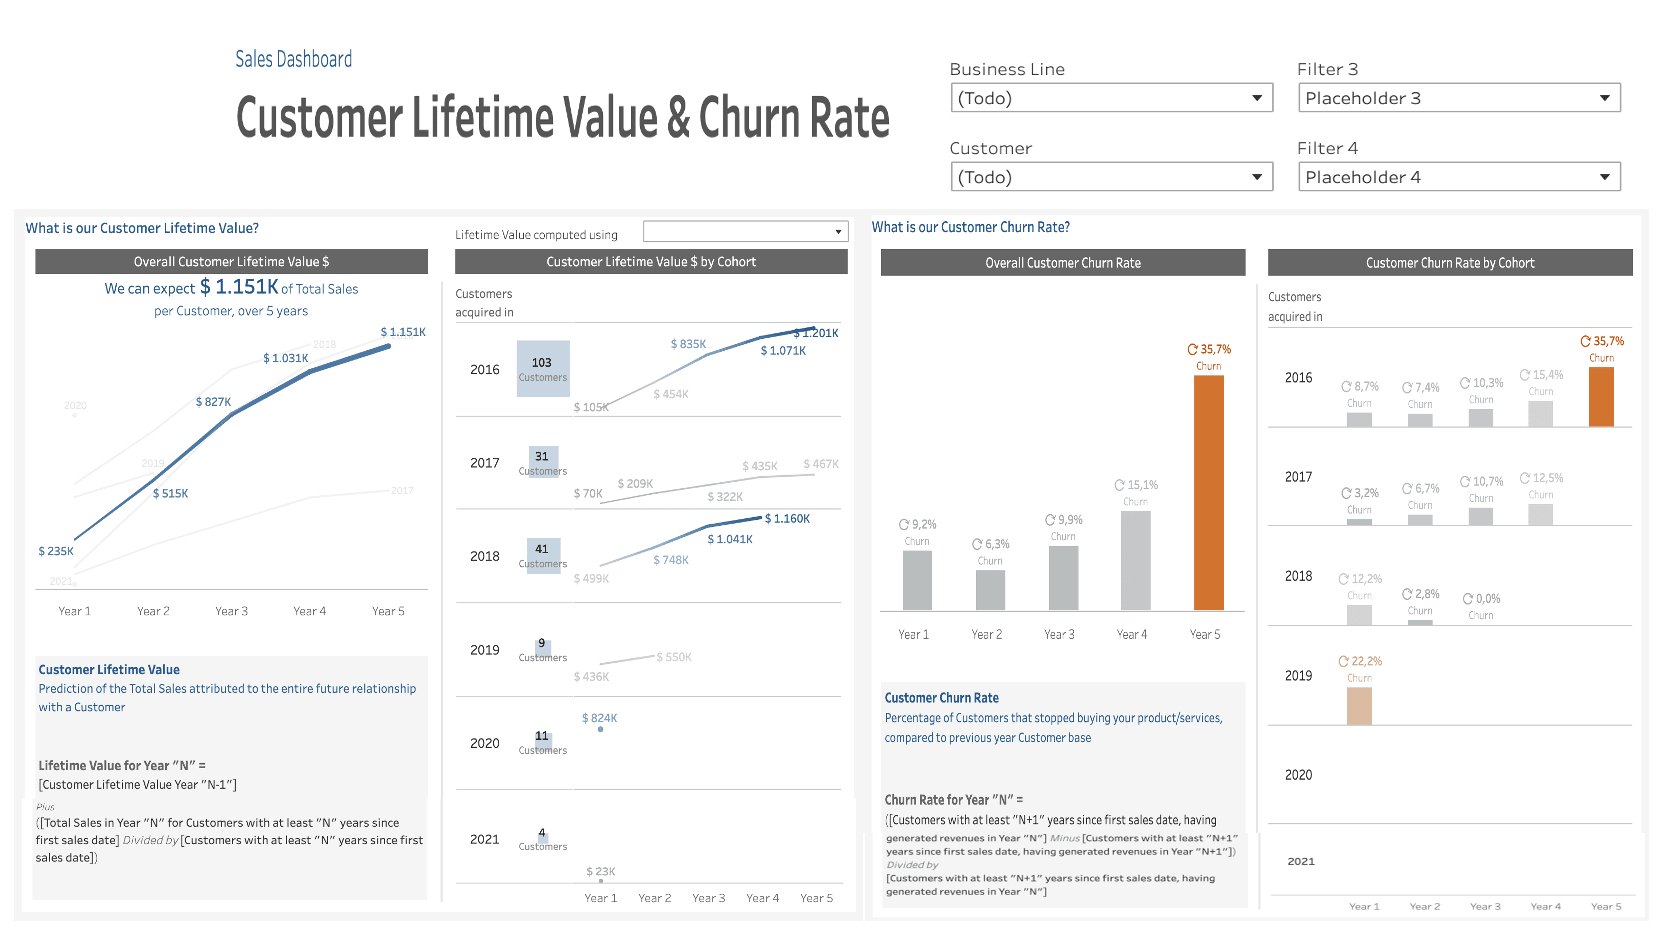
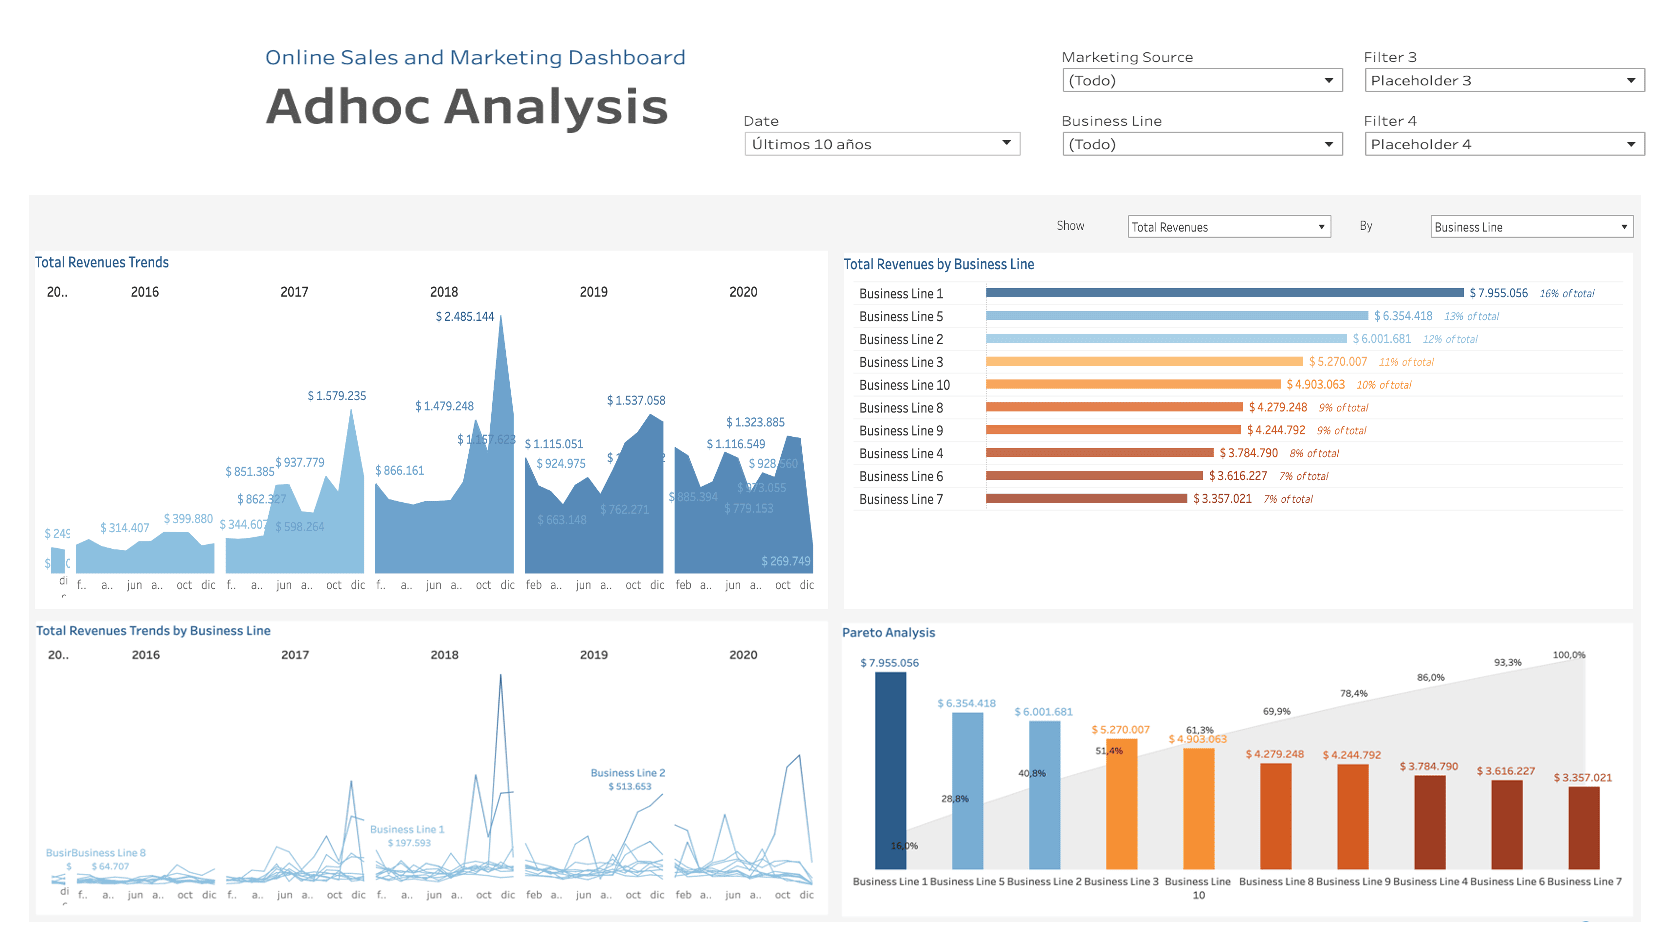
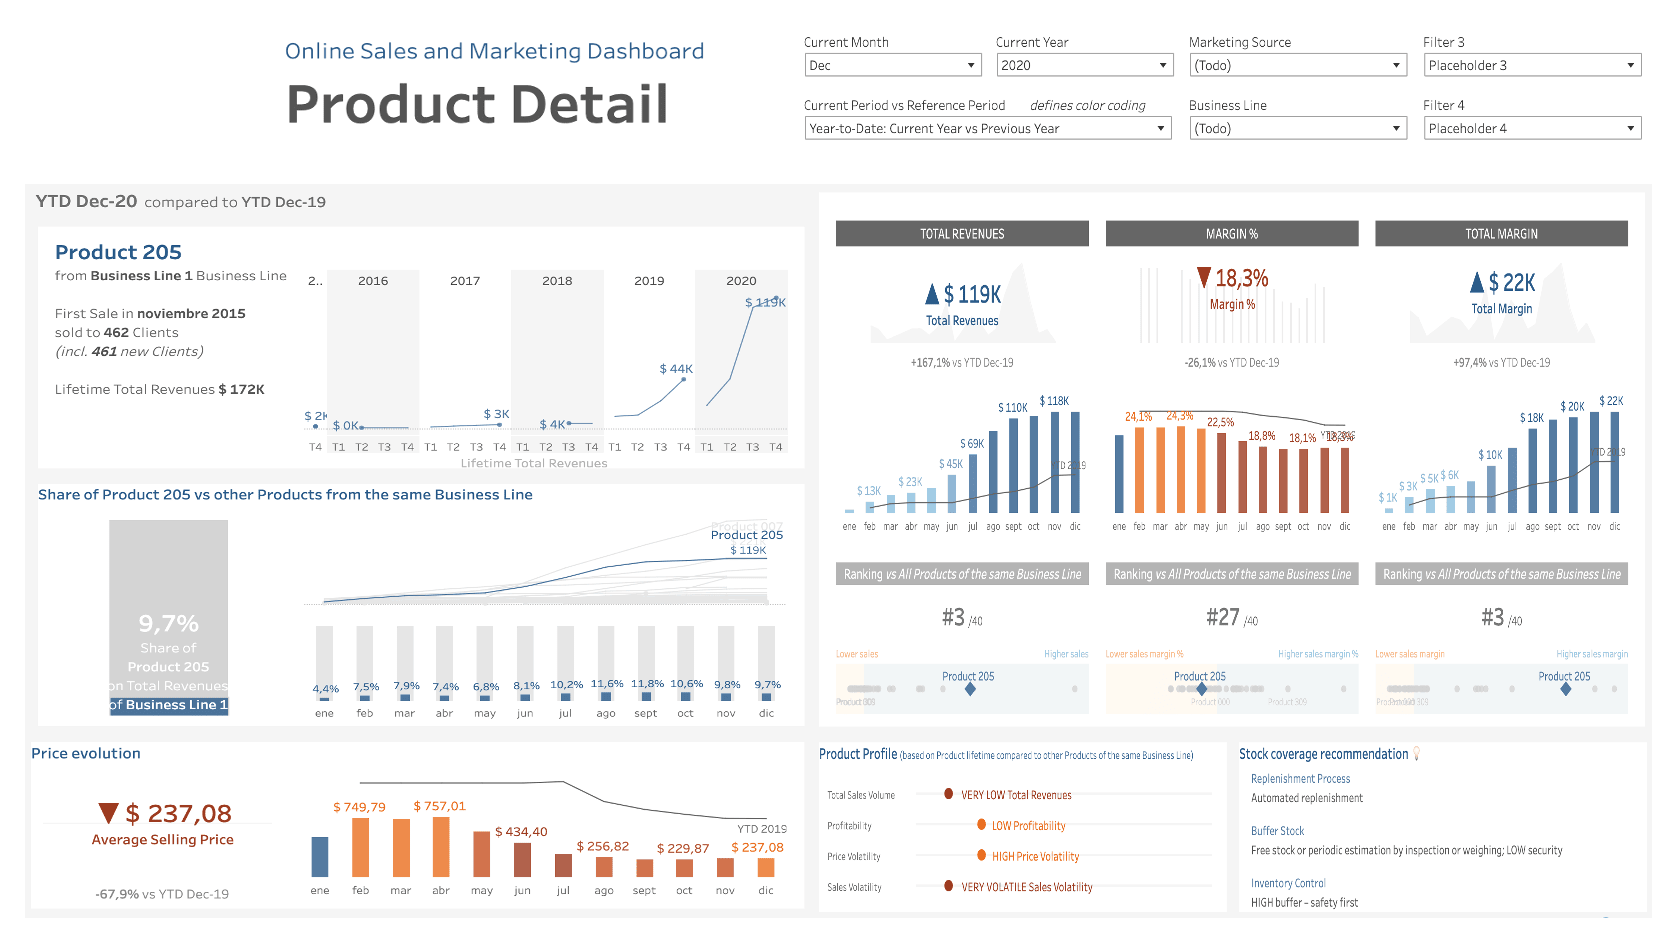
We design and create automated reports, turning data into knowledge.
The real power lies in data visualization and the new way of doing business leads us to use data to tell stories, using charts and visualizations, using analytics tools and techniques to make better decisions based on facts and data.
We include key elements to make visualizations powerful and meaningful: the information or data analyzed, the story or concept that adds meaning to the data and makes it interesting, the purpose that makes our data useful, and visual representations to create beauty and structure.
Save time and money with automated reports
Managerial and operational reports
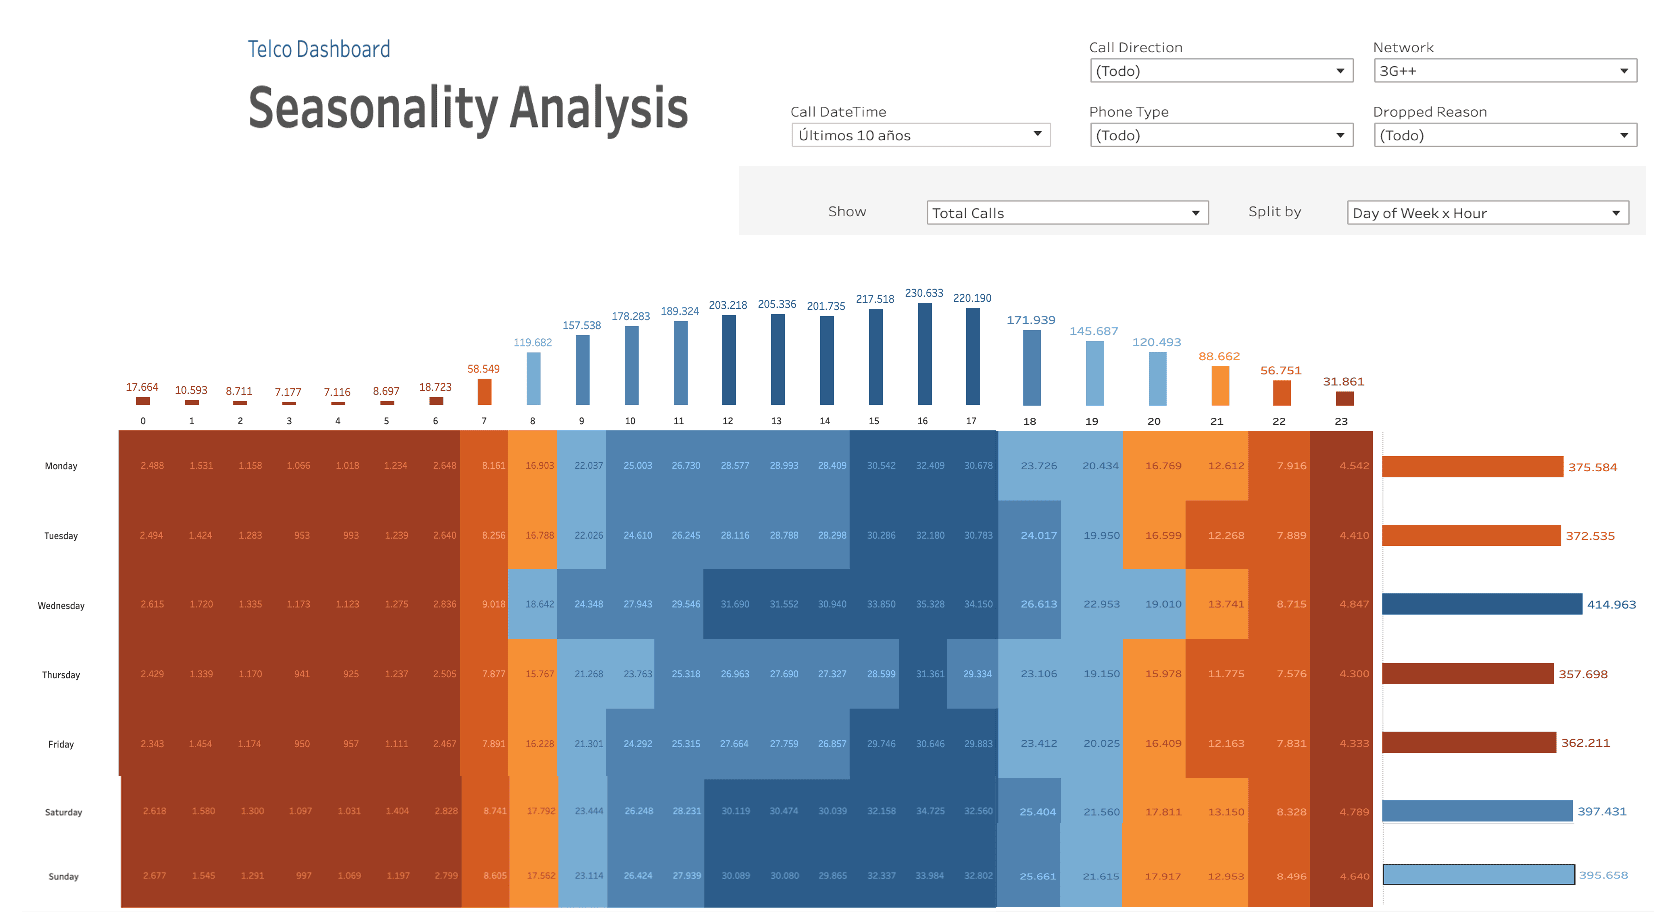
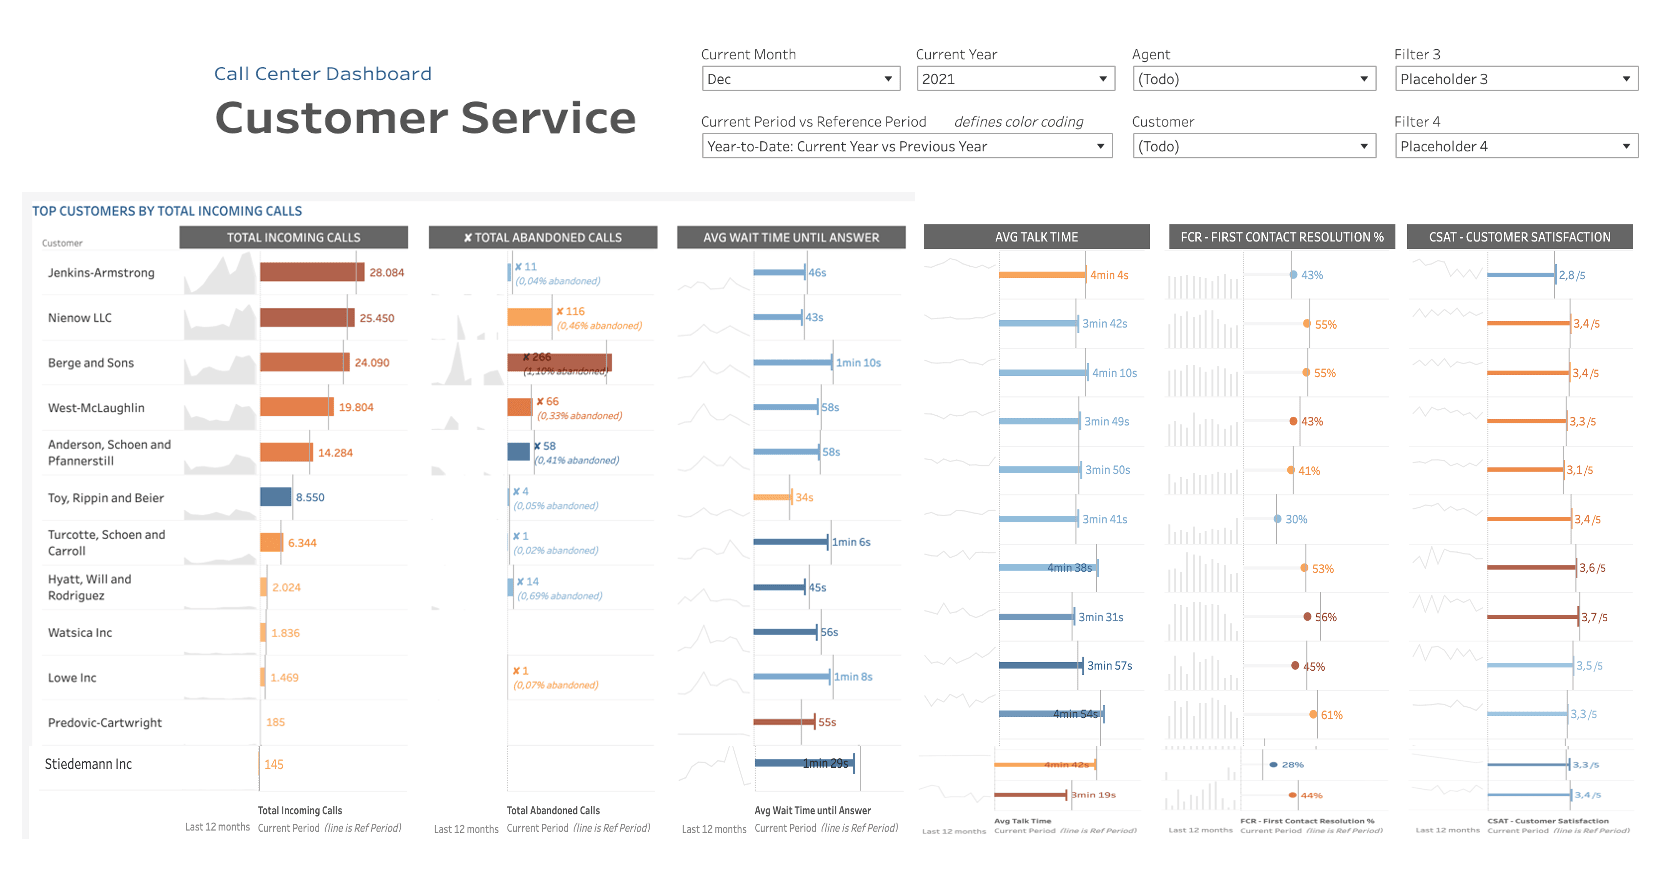
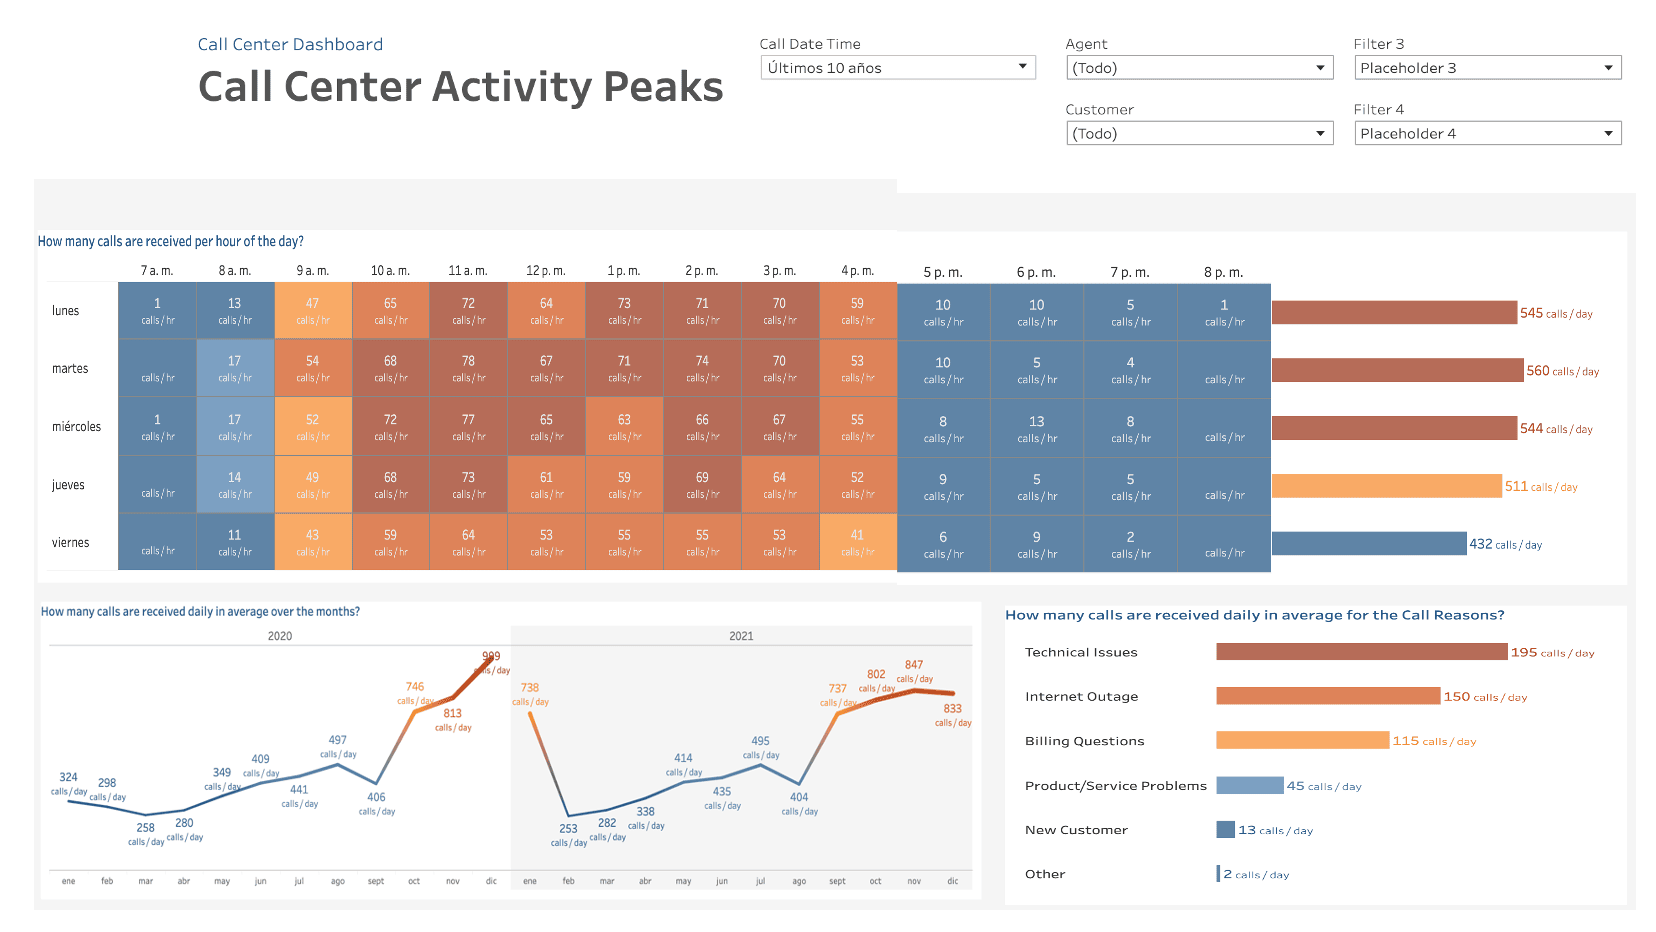
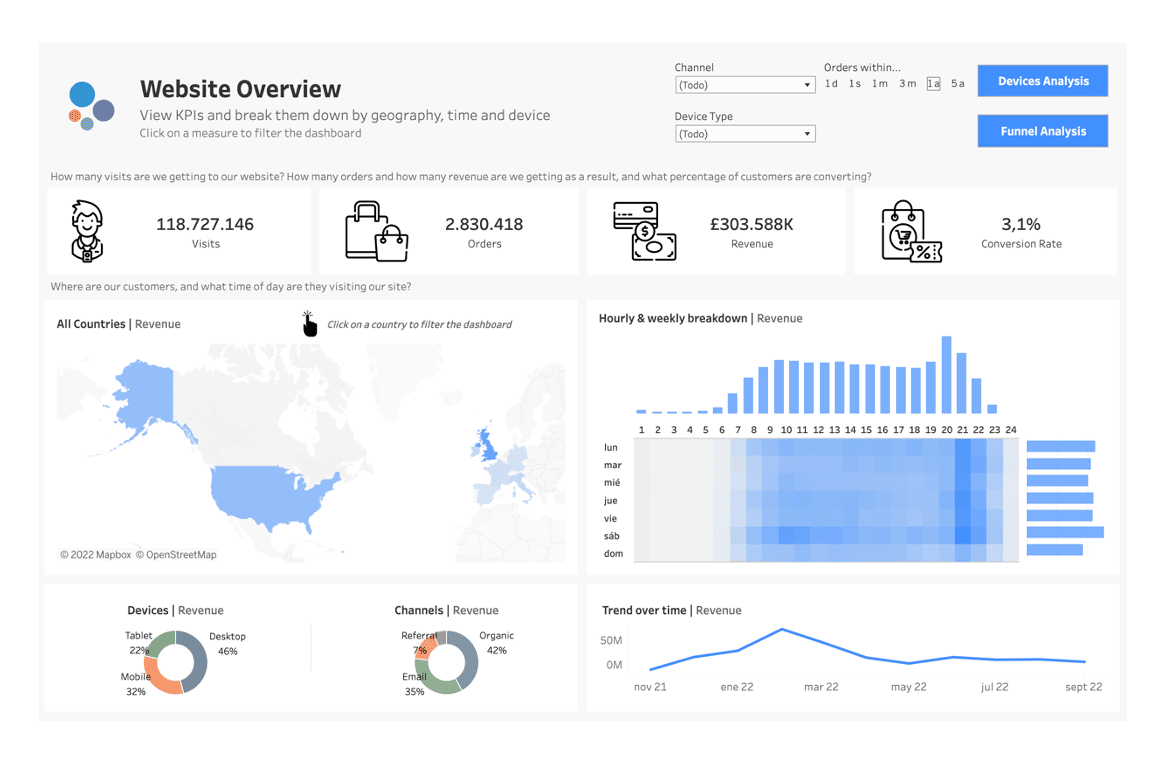
We design and create automated reports for each key area of the business. This will allow you to always see trends and patterns, it is possible to track changes over different time periods or visualizations of the behavior of KPIs and key metrics.
It is possible to see the information associated with the behavior of the business separated in different management and operational reports according to each need.
These reports can be generated with stored or real-time information that add value to business decisions and strategy, and that generate a competitive advantage.
You don’t need a BI department! We create it, maintain it, and update it.
Solution Benefits:
Develop and maintain a scalable, governed, and self-sufficient data environment within an ever-changing data landscape.
Build governance and trust in the data used to make decisions across the organization.
Increase discoverability so users can quickly and confidently find the right data for their analyses.
Effectively manage data at scale with repeatable processes to keep data and metadata updated.
You can access all your reports in a single place, at anytime
You can also view them from your laptop, tablet or mobile
We have a solution for each industry and each need

Start your journey here
Our team will be happy to advise you, with no obligation. Let’s discuss your project and find the perfect solution for your needs!
E-mail: info@binalytics.ai
Solutions
© 2022 | Binalytics SAS Company | All Rights Reserved
